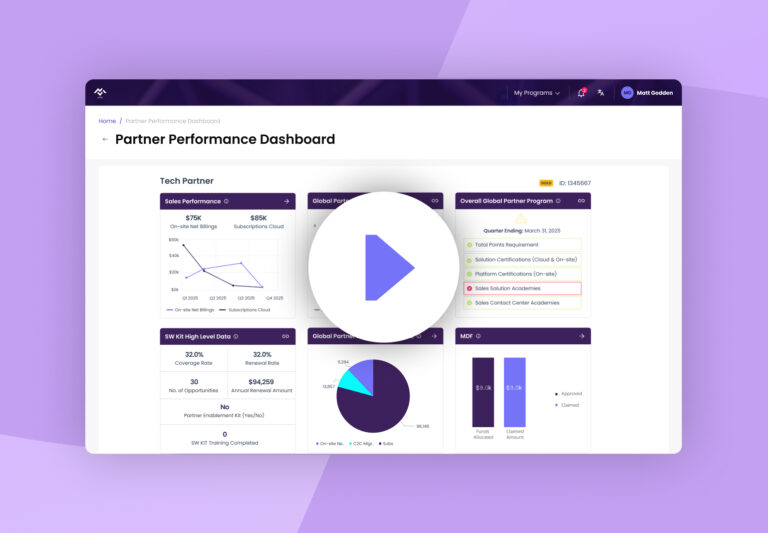
Building the Business Case for a Partner Performance Dashboard
Most channel leaders have plenty of data, but not enough clarity. Learn how a Partner Performance Dashboard helps connect the dots between partner activity, business impact, and smarter investment decisions.
Scroll down to read the full eBook. No form required.
Resources › eBooks › Building the Business Case for a Partner Performance Dashboard
Table of Contents
TL;DR
Most channel teams aren’t struggling with a lack of data—they’re struggling with a lack of clarity. When partner performance lives across spreadsheets, CRM, PRM, LMS, and reporting tools, decisions become reactive and proving channel impact becomes harder than it should be. It’s no surprise that 98% of vendors cited visibility into partner performance as a key driver for implementing a dashboard, while 64% said data complexity is their biggest obstacle.
The strategic advantage isn’t better reporting. It’s creating a single source of truth that helps channel leaders spot opportunities sooner, justify investment with confidence, and turn partner management from an administrative exercise into a growth lever.
If partners are expected to perform like an extension of your business, they need to be measured like one.
Meet the Panel
Background to this eBook on Partner Performance Dashboards
Channelscaler recently hosted a virtual panel delving into the topic of Partner Performance Dashboards (PPD). On the day, the panel explored how to successfully implement an effective partner- leveling program and the benefits for vendors and partners.
The panel featured senior partnering executives:
Don Lopes, Snr Director, Global Partner Programs at Juniper Networks
John Andrews, VP Global Channels at Invicti
KennethFox, CEO at Channelscaler
Margaret Adam, Director of Product Marketing at Channelscaler
By polling the audience of 75 vendors across multiple countries, we were able to capture new insights into the benefits and challenges associated with adopting a data-driven approach to partner management and Partner Performance Dashboards.
What is a Partner Performance Dashboard?
A Partner Performance Dashboard (PPD) is a comprehensive data visualization solution that provides real-time insights into partner performance, engagement, and impact.
It serves as a single source of truth for partner-related data, consolidating information from various systems and sources into an easily digestible format.
Whilst different companies may measure different metrics, Partner Performance
Dashboards typically include:
Data visualizations of performance against key success metrics
Drill-down capabilities for deeper insights into specific data points
Integration with existing CRM, PRM, LMS and other systems
Performance trends and, in cases, predictive forecasts
These dashboards are primarily used by channel leaders to assess performance and trends within the partner ecosystem, while partner account managers use them to explore detailed analytics for individual partners.
Top Tip: Develop a version of the dashboard accessible to partners through their portal, creating a unified, single source of truth for both you, and your partners.
4 Steps to Building the Business Case for a
Partner Performance Dashboard
1.
Identify Key Benefits & Business Outcomes
2.
Determine Key Metrics for Partner Success
3.
Mitigate Potential Obstacles & Challenges
4.
Develop The Business Case
1. Identify Key Benefits & Business Outcomes
The first step is to outline the advantages of implementing a Partner Performance Dashboard (PPD).
Enhanced Visibility on Partner Performance and Impact:Having a trusted view of partner performance across key metrics and KPIs means you can easily assess how partners are performing. This is by far the most common reason for implementing a PPD, with 98% of those polled citing this as the primary driver behind their decision to implement one.
Enhanced Transparency: Nearly 7 in 10 companies implemented a PPD to increase visibility into their channels’ contributions to the business. Ensure partner activities align with overall company goals. A key motivator is the ability to effectively respond to questions from leadership, like: “What is the channel doing for us?”
Data-Driven Decisions:The ability to make informed decisions based on accurate partner data rather than gut-feel and instinct. Identify top-performing partners as well as areas requiring additional support to help decide where to allocate investment and resources to. Two thirds of respondents implemented a PPD to help them easily identify areas of improvement.
Improved Partner Management and Reporting: Provide partners with clear insights into their performance and areas for improvement. Partner Managers benefit from more efficient reporting, dramatically reducing time spent on manual data collection for planning and quarterly business reviews (QBRs). This was a key business case justification for close to 60% of respondents.
Top Tip: Engage stakeholders early in the process. Collaborate with sales, revenue operations, partner operations, marketing and partner teams to understand how a PPD could benefit them and use this in your business case proposal.
2. Determine Key Metrics for Partner Success
Before implementing a PPD, it’s crucial to be thoughtful about what metrics will provide a comprehensive view of partner performance and that are aligned to your business objectives. Consider for example metrics like:
Top Tip: Don’t be overwhelmed by the task of gathering data for all metrics at once. Most companies develop their dashboards gradually. Start with one or two metrics where you already have reliable data, and then expand as new data sources become available.
Typically, we see a mix of both sales and partner program metrics.
“Think about how to support partners across a wide range of different shapes and sizes and roles with customers. How do you give them the right intelligence, the right support and the right performance to be able to drive profitability?”
Don Lopes Snr Director, Global Partner Programs Juniper Networks
“It’s almost like a Quarterly Business Review (QBR) on the fly. It’s a QBR running in real time, which makes your partners’ life that much easier.”
Kenneth Fox CEO
Channelscaler
3. Mitigate Potential Obstacles and Challenges
When implementing a Partner Performance Dashboard, several challenges commonly arise. When building the business case, show that you have thought through potential challenges and solutions. By outlining potential hurdles, you demonstrate a thorough understanding of the project and your readiness to address issues as they arise.
Here’s some guidance on how to address them effectively, leveraging insights from the industry experts on our panel:
Complexity of Data (64%): Partner data is complex and managing multiple data sources is the biggest challenge. Kenneth Fox emphasizes the value of working in partnership with a PPD specialist like Channelscaler. “We’ve developed a good process to simplify data management, making it less daunting than it seems.” Focus on prioritizing only essential data streams and using integration tools that consolidate information efficiently.
Data Integration and Aggregation (48%):Integrating multiple sources of data is also complex. This can also be overcome by partnering with a specialist provider like Channelscaler, that has optimized connectors to common CRM and PRM systems. Kenneth notes, “Getting data and integrating it is not as hard as it used to be. Start with basic data feeds and expand as needed.”
Defining Relevant KPIs (36%): Collaborate with stakeholders across sales, marketing, and partner management to identify KPIs that align with overall business objectives. Kenneth advises starting small:“Begin with the most important three or four KPIs. You can always add more as you refine your strategy.”
Internal IT Support (27%): Engage IT early in the process to ensure they understand the strategic importance of the dashboard. Highlight how it will streamline operations and reduce manual workload. Don Lopes suggests leveraging partner feedback to gain internal support: “Use partner conversations to stimulate excitement and compel action.”
Securing Sponsorship and Budget Approval (24%):Build a compelling case by demonstrating potential time savings and ROI. John Andrews recommends gaining consensus across departments:“If you can get buy-in from sales, customer success, and other key stakeholders, it’s far easier to secure approval from executives.”
4. Develop the Business Case
Build a compelling argument to secure buy-in and funding:
Demonstrate Efficiency Gains: Calculate hours saved by consolidating data sources. Highlight the inefficiencies of current systems where account managers spend excessive time accessing multiple platforms. By consolidating data into a single dashboard, significant time savings can be achieved, which translates into cost savings. For example:“By implementing a PPD, we estimate saving 20 hours per week.”
Demonstrate ROI:Show how improved visibility impacts revenue. For example:“A 5% improvement in deal registration conversion could add $2 million in revenue.”
Align with Strategic Goals:Tie the PPD to business objectives. For example:“The PPD supports our goal of increasing channel contribution to 60% of total revenue.”
“There’s so many different ways to do this. One customer we worked with added up how many hours a week they spent going to multiple systems to get data. Their PPD was actually paying for itself in less than three quarters.”
Kenneth Fox CEO Channelscaler
Highlight Competitive Advantage:Differentiate your program from competitors. For example: “Implementing a PPD makes us a vendor that is easy to do business with.”
Leverage Partner Feedback: Use feedback from partners to demonstrate the demand and necessity for a PPD. If partners express difficulty in accessing and understanding their performance data, this can be a compelling argument for investment.
Get Creative about Budgeting:Identify opportunities to reallocate budget from other areas. For instance, renegotiating contracts with other vendors can free up funds for the PPD.
Real World Lessons:
The Juniper Networks Journey
Juniper Networks provides a compelling example of how to effectively implement a Partner Performance Dashboard (PPD). During the panel discussion, Don Lopes shared Juniper’s experiences implementing a PPD in partnership with Channelscaler.
Here’s five key lessons learned along the way:
Simplification:Juniper aimed to streamline partner interactions by consolidating various data points into a single, user-friendly dashboard. Don Lopes noted,“We saw it as a great way for us to bring simplification to our partners.”This approach reduced complexity and made it easier for partners to access essential information.
Rapid Implementation:Juniper successfully implemented their PPD within 4-6 weeks, a timeline significantly shorter than overhauling multiple individual systems would have required. The PPD solved the challenge of multiple sources of data. This quick deployment allowed them to respond swiftly to market demands and partner needs.
Addressing Gaps:The dashboard helped Juniper identify and close critical gaps in their partner engagement strategy. As Lopes explained, “We closed some really important gaps. Prior to this, we didn’t make it easy for partners to really know their performance.”By centralizing data, they improved transparency and communication.
Iterative Improvement:Juniper adopted an iterative approach, starting with basic metrics and gradually incorporating more sophisticated KPIs and features. This allowed them to refine the dashboard based on real-world feedback from partners and evolving business needs.
Driving Adoption:To ensure widespread use of the PPD, Juniper integrated it into their Quarterly Business Review (QBR) process. This encouraged partners to engage with the dashboard regularly, demonstrating its value in tracking performance and planning future activities. By focusing on simplification, rapid deployment, and continuous improvement, Juniper successfully leveraged their Partner Performance Dashboard to enhance partner relationships and drive business growth.
Final Words of Advice
“We’re here to drive sales, and that’s the key thing we want to be able to use as our pillar. When we look at metrics and work with our partners, it’s about how we develop the right consistency of metrics that allows them to achieve their goals in the right way.”
Don Lopes Snr Director, Global Partner Programs Juniper Networks
“If you can get buy-in from sales, customer success, and other key stakeholders, it’s far easier to secure approval from executives. Get the buy-in of the sales organization, their VPs, your CRO, ensuring they understand the benefits of say measuring net-new incremental pipeline. It is then far easier to take that conversation up to a CFO or a CEO.”
John Andrews VP, Global Channels
Invicti
“Just do it! Start with maybe the most important three or four KPIs. And you can always add to that later, because remember, that’s a significantly better experience for your partners than you have today on your spreadsheets.”
Used to determine whether a user is included in an A / B or Multivariate test.
18 months
_gat
Used to monitor number of Google Analytics server requests when using Google Tag Manager
1 minute
_gid
ID used to identify users for 24 hours after last activity
24 hours
_ga_
ID used to identify users
2 years
_gali
Used by Google Analytics to determine which links on a page are being clicked
30 seconds
_ga
ID used to identify users
2 years
__utmv
Contains custom information set by the web developer via the _setCustomVar method in Google Analytics. This cookie is updated every time new data is sent to the Google Analytics server.
2 years after last activity
__utmz
Contains information about the traffic source or campaign that directed user to the website. The cookie is set when the GA.js javascript is loaded and updated when data is sent to the Google Anaytics server
6 months after last activity
__utmc
Used only with old Urchin versions of Google Analytics and not with GA.js. Was used to distinguish between new sessions and visits at the end of a session.
End of session (browser)
__utmb
Used to distinguish new sessions and visits. This cookie is set when the GA.js javascript library is loaded and there is no existing __utmb cookie. The cookie is updated every time data is sent to the Google Analytics server.
30 minutes after last activity
__utmt
Used to monitor number of Google Analytics server requests
10 minutes
__utma
ID used to identify users and sessions
2 years after last activity
_gac_
Contains information related to marketing campaigns of the user. These are shared with Google AdWords / Google Ads when the Google Ads and Google Analytics accounts are linked together.
90 days
Google Tag Manager simplifies the management of marketing tags on your website without code changes.
Name
Description
Duration
_gcl_au
3 months
It’s a first-party cookie for maintaining a unique visitor identifier. This cookie is used for WebSights, FormComplete, Chat and Schedule products. It contains an opaque GUID to represent the current visitor
Name
Description
Duration
_zitok
12 months
Marketing cookies are used to follow visitors to websites. The intention is to show ads that are relevant and engaging to the individual user.
HubSpot is an all-in-one marketing, sales, and customer service platform that streamlines business growth.
Name
Description
Duration
hubspotutk
6 months
__hstc
6 months
__hssrc
Session
__hssc
30 minutes
Tracks conversions and enables ad retargeting for LinkedIn advertising campaigns.